A suite of graphical user
interface (GUI) applications has been developed to provide convenient access
to most of the capabilities of the GCE Data Toolbox. These applications use
standard menus, graphical controls, and platform-specific dialog boxes for
input, and do not require any experience with the MATLAB environment or
programming language. The principle applications are described briefly below:
| Screen Shot |
Program Description |
 |
GCE Data
Tools Startup Screen (ui_aboutgce) -- Default startup screen,
providing access to the Data Structure Editor, function list, and
documentation. Also displays the toolbox disclaimer and usage
agreement.
|
 |
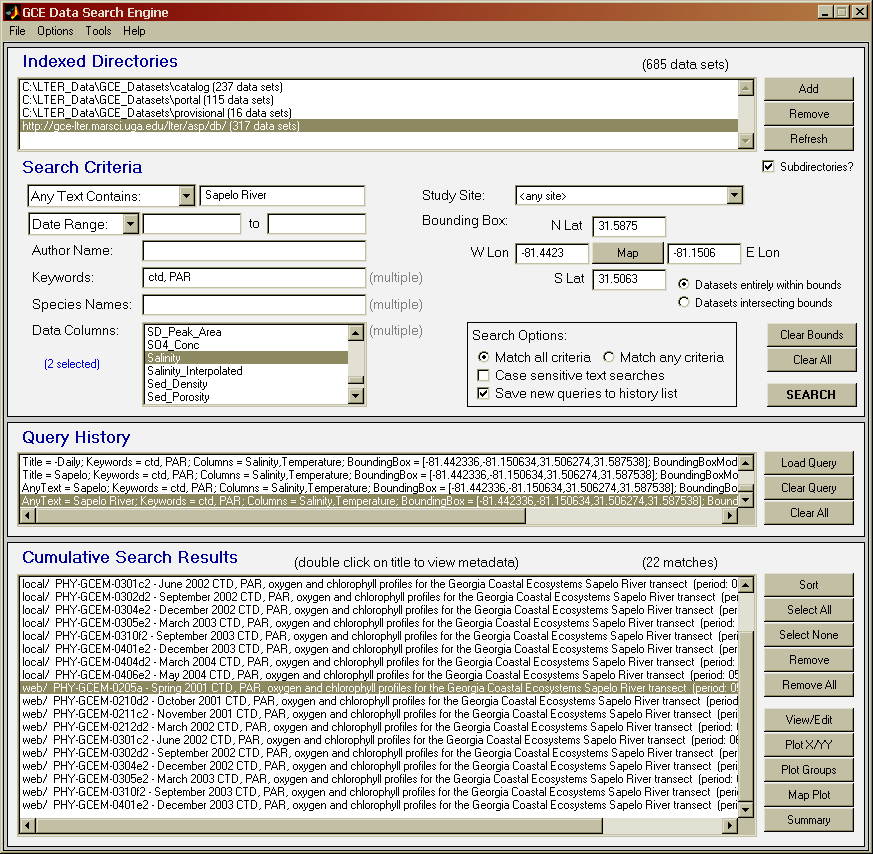
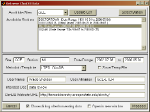
Data Search
Engine (ui_search_data) -- Application for performing metadata-based searches to identify GCE Data Structures that meet
specific thematic, temporal, and geospatial criteria. In order to support searching, data structures are first analyzed using a combination of metadata and data mining techniques to generate an optimized search index. Data structures stored in MATLAB files in any number of local directories can be indexed, and indices can be saved and re-used to speed subsequent searches. Pre-generated indices of public data sets in the GCE Data Catalog and GCE Data Portal can also be downloaded and merged with local indices to support simultaneous searches of local and web-based data holdings.
|
 |
Data
Structure Editor (ui_editor) -- This application is the
primary starting point for all the GUI applications. It is used to
create and edit GCE Data Structures, export data and metadata in
various formats, and access various toolbox functions and other GUI
applications via menu and button selections. Column descriptors
can be edited using the controls below the variable list, and columns
can be reordered, previewed, or deleted using the button panel to the
right. Advanced editing commands and tools are accessed via the
menubar at the top of the window.
|
 |
Data Editor (ui_datagrid)
-- Displays data structure values in a scrollable grid layout (i.e.
spreadsheet) for display and editing. QA/QC-flagged values are
displayed in red, and multiple view modes are supported. Values
can be edited (with format enforcement based on metadata settings),
and groups of rows can be selected for copying or deletion, with all
changes individually logged to the structure processing history.
|
 |
Metadata
Editor (ui_editmetadata) -- Displays general metadata stored
in a data structure and allows the contents of individual fields to be
viewed and edited.
|
 |
Title Editor
(ui_title) -- Displays the title of a data structure for
editing, and synchronized title changes with the metadata.
|
 |
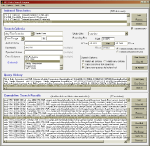
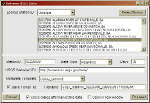
Custom ASCII
Import dialog (ui_importfilter) -- Dialog for customized importing of delimited ASCII text files. Support is provided for non-standard header formats and multiple missing value codes, and format strings and column titles can be automatically parsed or entered manually. An interactive file viewer display is also provided.
|
 |
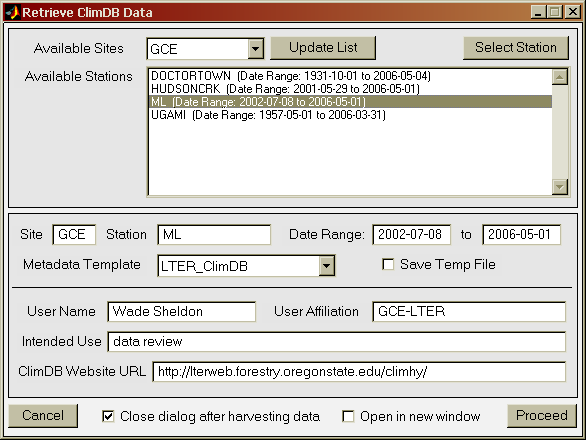
ClimDB/HydroDB Import dialog (ui_harvestclimdb) -- GUI dialog for
retrieving data from the LTER ClimDB/HydroDB database. An updated lists of sites, stations
and parameters can be updated on demand from the ClimDB/HydroDB server, and then data from
any station and time range can be retrieved to create a GCE data structure for analysis and
display.
(Note: MATLAB 6.5/Release 13 required) |
 |
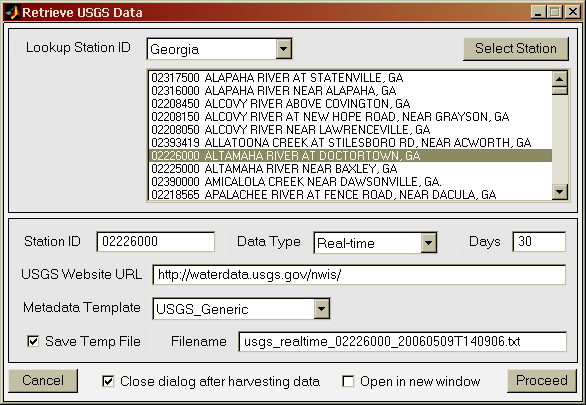
USGS WWW Import dialog (ui_harvestusgs) -- GUI dialog for retrieving data from the USGS WWW server. Real-time, daily and finalized data can be retrieved for any supported station for the specified number of days. A list of Real-time stations is provided for look-up by state.
(Note: MATLAB 6.5/Release 13 required)
|
 |
ASCII Export
dialog (ui_exportasc) -- Dialog for saving data and metadata
in data structures in a variety of delimited ASCII text formats.
Various metadata formats and styles are available, and column
statistics reports can also be appended below the data table for
archival validation purposes or reporting.
|
 |
ClimDB/HydroDB
Export
dialog (ui_expclimdb) -- Dialog for exporting data sets as comma-delimited text files in LTER ClimDB/HydroDB format. Data sets are automatically
re-sampled to daily intervals, values flagged 'I' (invalid) are removed, coded flag columns are created detailing flagged and missing values, and attribute names and units are converted to corresponding ClimDB/HydroDB names and units by the function 'exp_climdb', based on user-defined attribute mapping information stored in the file 'exp_climdb.mat'.
|
 |
Column
Calculator (ui_calculator) -- Dialog for adding new
calculated columns to a data structure based on user-defined
mathematical expressions. Both guided and manual
expression-building is supported, and scalar results can optionally be
expanded to fill the entire column.
|
 |
Unit
Conversion (ui_unitconv) -- Dialog for performing unit
conversions on an individual data column using predefined or
user-customized multipliers or equations. The selected
conversion formula is added to the metadata as a calculated column
definition.
|
 |
Query Builder
(ui_querybuilder) -- Dialog for interactively building a
custom query string to select rows in a data structure by value and
create a subset structure.
|
 |
Sort Columns
(ui_sortcolumns) -- Dialog for bi-directionally sorting rows
in a data structure based on values in one or more specified columns.
|
 |
Join Data (ui_joindata)
-- Dialog for joining two data structures based on common values in
one or more matching 'key' columns, creating a new structure
containing the key columns and user-selected data columns from both
structures (optionally renamed by adding text prefixes to distinguish
identical column names). All standard relational join types are
supported (i.e. inner, left, right, and full outer).
|
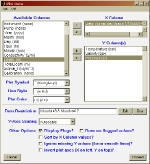 |
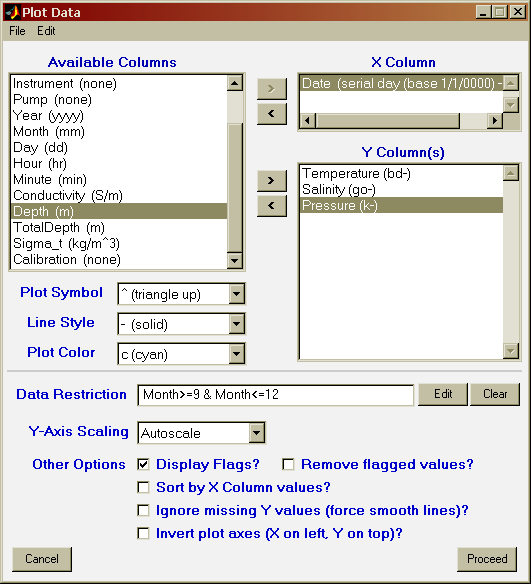
Plot Data (ui_plotdata)
-- Dialog for creating multiple-Y vs. X symbol/line plots of values in
a data structure, optionally restricting values by values in one
specified column (i.e. inline query).
|
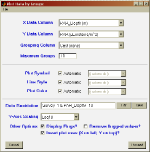 |
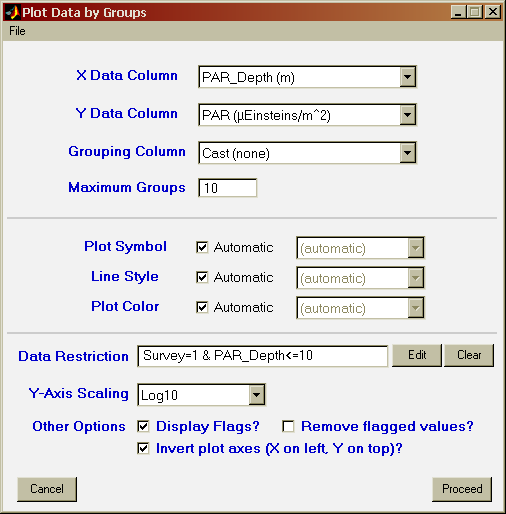
Plot Groups (ui_plotgroups)
-- Dialog for creating a Y vs. X symbol/line plot of values in a data
structure after grouping rows by values in a specified column. One
line segment is produced per group after optionally restricting values
by values in another specified column (inline query).
|
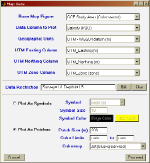 |
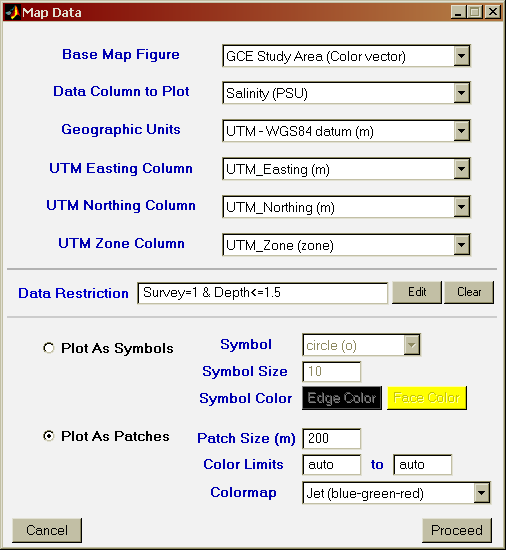
Map Data (ui_mapdata)
-- Dialog for plotting values or text in a data structure containing
georeference columns (i.e. latitude/longitude or UTM/WGS84) on a map
plot as symbols, text labels, or color-mapped patches with a color
scale bar.
|
 |
Statistics
Report Builder (ui_statreport) -- Dialog for generating
customized column statistics reports in various delimited ASCII
formats.
|
 |
Statistics
for Grouped Data (ui_aggrstats) -- Dialog for creating
customized statistical summaries of values in a data structure by
specifying a series of columns to sort and group by and a series of
columns to automatically calculate relevant statistics for. The
results are returned in a separate editor window for further
customization and analysis or export.
|
 |
Statistics
for Binned Data (ui_bindata) -- Dialog for calculating
statistics for selected columns after binning data by values in one
column (e.g. Depth) and optionally grouping records by values in one
or more data columns. The results are returned in a separate editor
window for further customization and analysis or export. |
 |
Date/Time Interval Statistics (ui_aggrdatetime) -- Dialog for creating customized statistical summaries for specifed date/time intervals (yearly, monthly, daily, hourly), optionally grouping by values in one or more non-date/time columns.
|
 |
Top/Bottom
Values (ui_topbottom) -- Dialog for for extracting top and
bottom data records from a data structure containing vertical profile
data based on values in a depth or pressure column. The results are
returned in a separate editor window for further customization and
analysis or export. |
 |
Visual QA/QC
Flag (ui_visualqc) -- Dialog for manually assigning QA/QC
flags for the selected data column (or group of values within a data
column) by clicking and dragging over data points on scatter/line
plots with the mouse. The control panel (top) is displayed alongside
the data plot (bottom), allowing the user to specify the
parameter/group to flag and flag code to assign. Existing flags can
also be cleared by right-clicking or right-dragging over the data
points. Results of flag assignments are displayed on the plot in real
time, and a log of all the flag operations and list of any new flag
codes defined during the analysis are automatically synchronized with
the metadata when flagging is complete and the structure is opened in
a new editor window. The contents of the data anomalies metadata field are
also displayed to allow for simultaneous documentation of manual QA/QC
operations. |
 |
QA/QC Flag
Definition Editor (ui_flagdefs) -- GUI dialog for editing
QA/QC flag code definitions stored in the data structure metadata, and
also describing any related data anomalies discovered during the QA/QC
process. |
 |
QA/QC Flag
Criteria Editor (ui_qcflags) -- GUI dialog for editing
automatic QA/QC flagging criteria for the selected column in the
Structure Editor window. |
 |
QA/QC Flag Copying Dialog (ui_copyflags) -- GUI dialog for copying composite flags from one or more columns and adding them to or replacing the existing flag arrays of one or more other columns (used to propagate flags to dependent/calculated columns)
|
 |
Selective QA/QC-Flagged
Data Removal Dialog (ui_clearflags) -- GUI dialog for selectively deleting data values or data rows based on QA/QC flag assignments. Subsets of data columns and flag definitions can be selected from lists of all available columns and definitions. The functions 'nullflags' or 'cullflags' are used to clear the affected values or rows,
resp.
|
 |
Template
Editor (ui_template) -- GUI dialog for creating, editing and
managing metadata templates used by the data structure editor and
import filters to assign column descriptors and boilerplate metadata
to new data structures based on column name and unit matching.
Templates stored in the data file 'imp_templates.mat' are converted to
data structures and opened in the data structure editor for inspection
and editing.
|
 |
Metadata
Style Editor (ui_metastyle) -- GUI dialog for creating,
editing and managing metadata style definitions which are used to
generate formatted metadata for preview and file export. Style
definitions specify general word wrap and indent options, and include
any number of format description rows consisting of static text,
expressions combining metadata fields with static text and/or MATLAB function output, and customized indent level and word wrapping
options.
|
 |
Documentation
Viewer (ui_viewdocs) -- Dialog for viewing the GCE Data
Toolbox documentation. Individual sections can be navigated
using the drop-down menus and buttons at the top of the screen.
|