GCE IV - Key Finding in 2024
Repeat drone imagery
Unmanned Aerial Vehicles (UAV), or drones, offer a cost-effective way to conduct targeted synoptic observations in the field. They are particularly useful in salt marshes, where study sites can be challenging to access. The GCE has a drone equipped with a 6-band multispectral camera that has a ground resolution of 5 x 5 cm. We started a program of monthly drone flights in January 2020 that has provided new insights into salt marsh disturbances and motivated new research questions. Lynn et al. (2023) used principal component analysis to identify ~2100 wrack patches in 20 images collected from a Sapelo Island marsh over the course of 2 years. They quantified wrack patches in terms of their size-frequency distribution, landscape position, and seasonal patterns, and identified the number of times wrack was found on individual pixels (Fig. 1). None of these tasks would have been possible without repeat drone imagery. The imagery was also used to identify patches that had been in place for > 2 months, which guided field sampling efforts (Pierce et al., subm.). Lynn et al. (in prep) is now using vegetation indices to develop a survivability model to gain more insight into plant recovery patterns following wrack disturbance. In the future, we plan to cross-calibrate the drone imagery with high-frequency but lower-resolution Planet satellite data (3-m pixels) to study long-term wrack distribution patterns and plant recovery across the GCE domain. The drone imagery was also used to track slump blocks, which are vegetated units along creek banks that break from the marsh platform and slump into the adjacent channel. Although these blocks had been previously observed, the repeat imagery documented their dynamics: we found that they are actively moving and most either submerge or reconnect to the bank over the course of 6-12 months (Yang et al. 2024). Slump block dynamics also have ecological implications: Gibbs et al. (subm.) found that mud crab densities were higher and predation pressure lower behind slump blocks versus other types of channel edge morphology. We are continuing to collect repeat high-resolution imagery and anticipate that it will lead to additional novel insights in the coming years.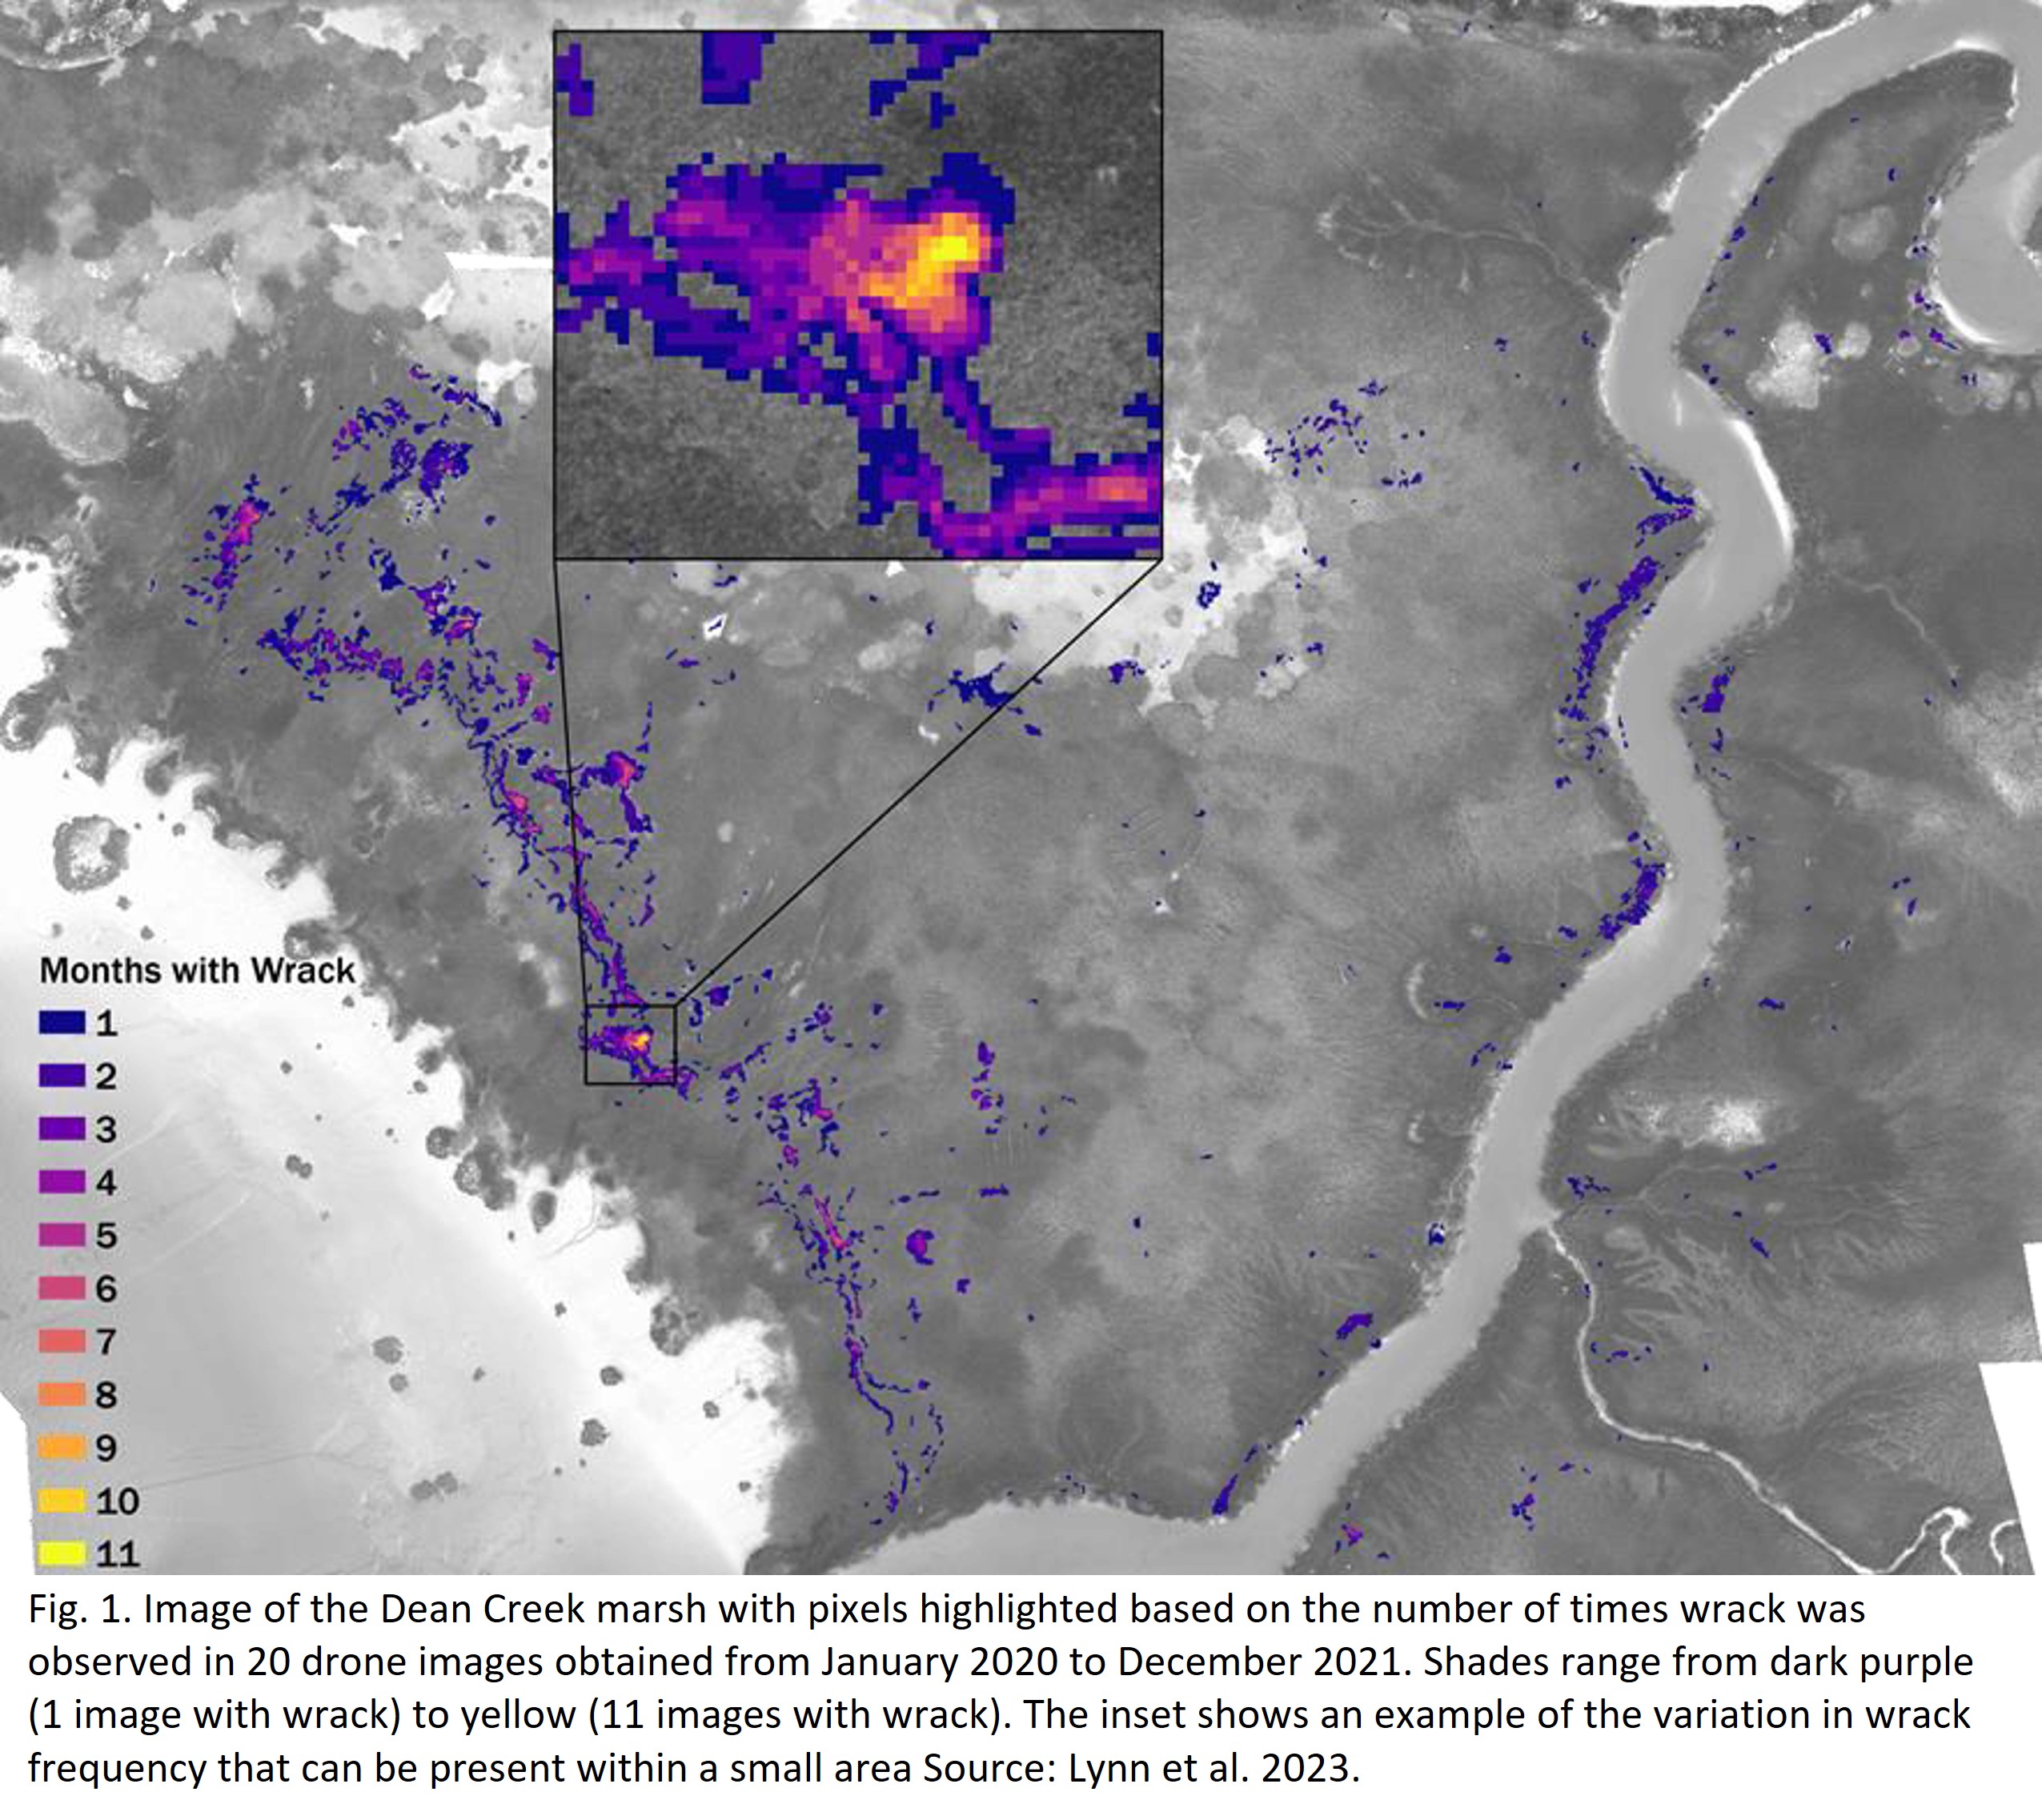
Fig. 1. Image of the Dean Creek marsh with pixels highlighted based on the number of times wrack was observed in 20 drone images obtained from January 2020 to December 2021. Shades range from dark purple (1 image with wrack) to yellow (11 images with wrack). The inset shows an example of the variation in wrack frequency that can be present within a small area Source: Lynn et al. 2023.
