|
|
Area 4: Integration and Scaling Up
|
|
Integration and Scaling Up
We use a combination of remote sensing, field investigations, and modeling to document and evaluate the consequences of long-term change and disturbance at the landscape scale.
Research Objectives
A) Disturbance-Scape
- 4A.1 - Assess the effects of wrack perturbations
- 4A.2 - Assess the effects of creek perturbations
- 4A.3 - Assess the effects of dieback and other perturbations
- 4A.4 - Synthesize results into a scaled-up disturbance-scape
B) Landscape Change
- 4B.1 - Track habitat shifts along the Altamaha River estuary salinity gradient
- 4B.2 - Conduct synoptic assessments of productivity
- 4B.3 - Evaluate long-term change in vegetated marsh areas
C) Modeling
- 4C.1 - Upgrade hydrodynamic models
- 4C.2 - Enhance soil model
- 4C.3 - Model plant production
- 4C.4 - Develop driver-response models
|
Current Progress Report
Below is an update for each of the Area 4 objectives as reported in the most recent annual report. For a list of all reports click here (Annual Reports).
A) Produce synoptic descriptions of ecosystem properties
- 4A.1 - Assess the effects of wrack perturbations
Activities: We continued processing monthly drone flights to identify wrack patches at both the Dean Creek and Belle Marsh sites, and completed field sampling of wrack and paired control areas at Dean Creek (plants, invertebrates, porewater, temperature, decomposition). We have developed a method that uses kriged estimates of NDVI to evaluate recovery from wrack deposition (Fig. 1). In the field, we completed all sample collections and analyses for porewater chemistry and teabag masses.
Significant Results: Our analysis of wrack survival showed that 75% of all areas disturbed by wrack patches had recovered within 6 months, but that recovery varies with season of wrack arrival, length of time the wrack is in place, and elevation.
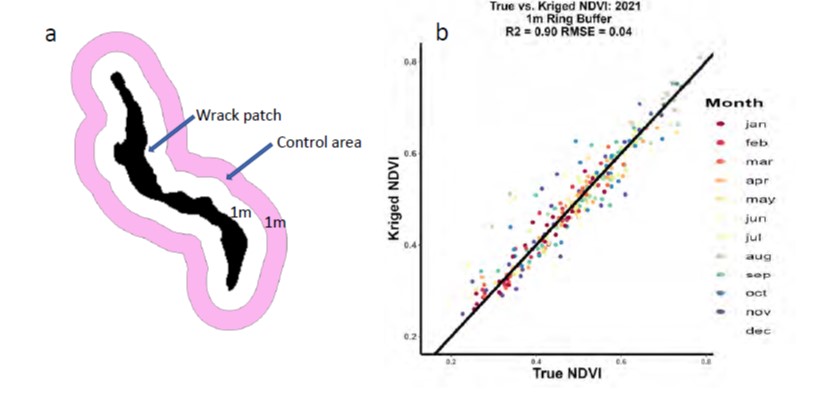
Fig. 1. a) Expected vegetation index (NDVI) values of wrack patches (black) is estimated by kriging values based on a 1-m wide ring located 1-m from the patch (pink). b) comparison of true vs. kriged values for patches over the course of the year. Source: Lynn et al., in prep.
- 4A.2 - Assess the effects of creek perturbations
Activities: We continued monthly field measurements of slump block elevation, which confirmed our observations that while most blocks are submerged over time, others reconnect
to the bank, which has not previously been reported. We continue to track slump block dynamics in monthly drone images of Dean Creek, (Obj 4A1), and conducted a sidescan sonar survey to assess their distribution on the creek bottom.
Significant Results: Yang et al. (2024) found a linear reduction in slump blocks over the a 5-month period, during which most were lost to submergence (Fig. 2). Morrison et al. (2024) found that bioturbation and grazing by the purple marsh crab, Sesarma reticulatum, influences sedimentation, hydrology, and organic matter turnover in grazed creeks, with implications for C storage.

Fig. 2. Changes in the number and area of a cohort of 61 slump blocks over time. Source: Yang et al. 2024.
- 4A.3 - Assess the effects of dieback and other perturbations
Activities: We continued field measurements in dieback areas, where we are sampling the same variables as those being monitored in the wrack patches (Obj 4A1).
- 4A.4 - Synthesize results into a scaled-up disturbance-scape
Activities: We are combining field and drone data to scale up the effects of wrack disturbance to the landscape scale. This past year we verified an algorithm to estimate Juncus roemerianus aboveground biomass from drone imagery, which we are now applying to images of Juncus stands captured with our monthly drone acquisitions at our Belle Marsh disturbance monitoring site.
Significant Results: Pierce et al. (subm.) used information on the frequency, extent, and duration of persistent wrack from aerial observations to scale up plot-level effects to the entire Spartina marsh. Only 0.1% of the area was covered by wrack of >2 month duration, which suggests that wrack is a minor disturbance at the landscape scale (Fig. 3).
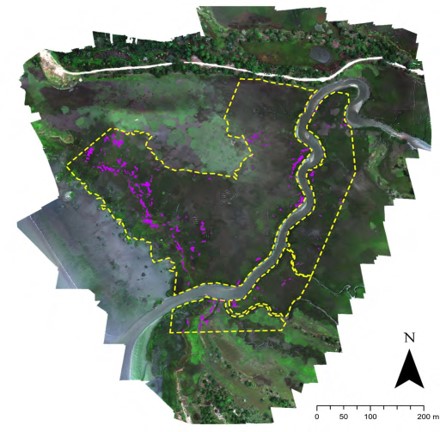
Fig. 3. The distribution of persistent wrack (purple patches) observed across the Spartina marsh (dashed yellow line) from March 2020 – December 2021. Persistent patches were defined as those present for more than one month. Source: Pierce et al., subm.
B) Landscape Change
- 4B.1 - Track habitat shifts along the Altamaha River estuary salinity gradient
Activities: We continue annual bankside surveys of Spartina and sentinel trees along the Altamaha River salinity gradient, and monitoring of mixed vegetation sites. This past year we collected new field data in the Altamaha River corridor to help create a Zizaniopsis millacea biomass algorithm for satellite imagery to supplement existing mapping of Spartina and Juncus biomass.
Significant Results: Costomiris et al. (2024) analyzed field surveys of forested plots in the tidal fresh forest in the Altamaha River (Fig. 4). Plots at the downstream extent had lower stem density, basal area, and species diversity than those further upstream, suggesting a response to higher salinity water (Fig. 4)
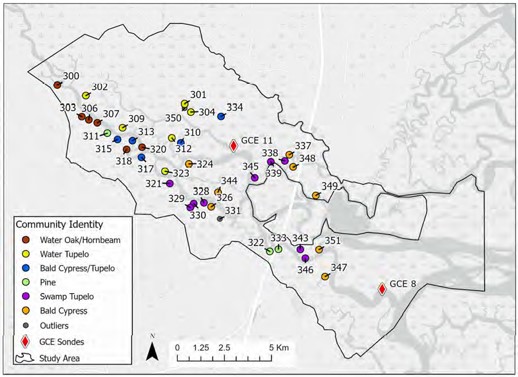
Fig. 4. The Distribution of tidal freshwater forest communities in the Altamaha River identified via hierarchical clustering. Source: Costomiris et al. 2024.
- 4B.2 - Conduct synoptic assessments of productivity
Activities: Runion (2024) updated and expanded our BERM model, which is a geoinformatics tool that was developed to predict belowground biomass (BGB) of Spartina.
Significant Results: The BERM model can be used to provide landscape-level predictions of belowground biomass as well as a suite of predictor variables (Fig. 5).
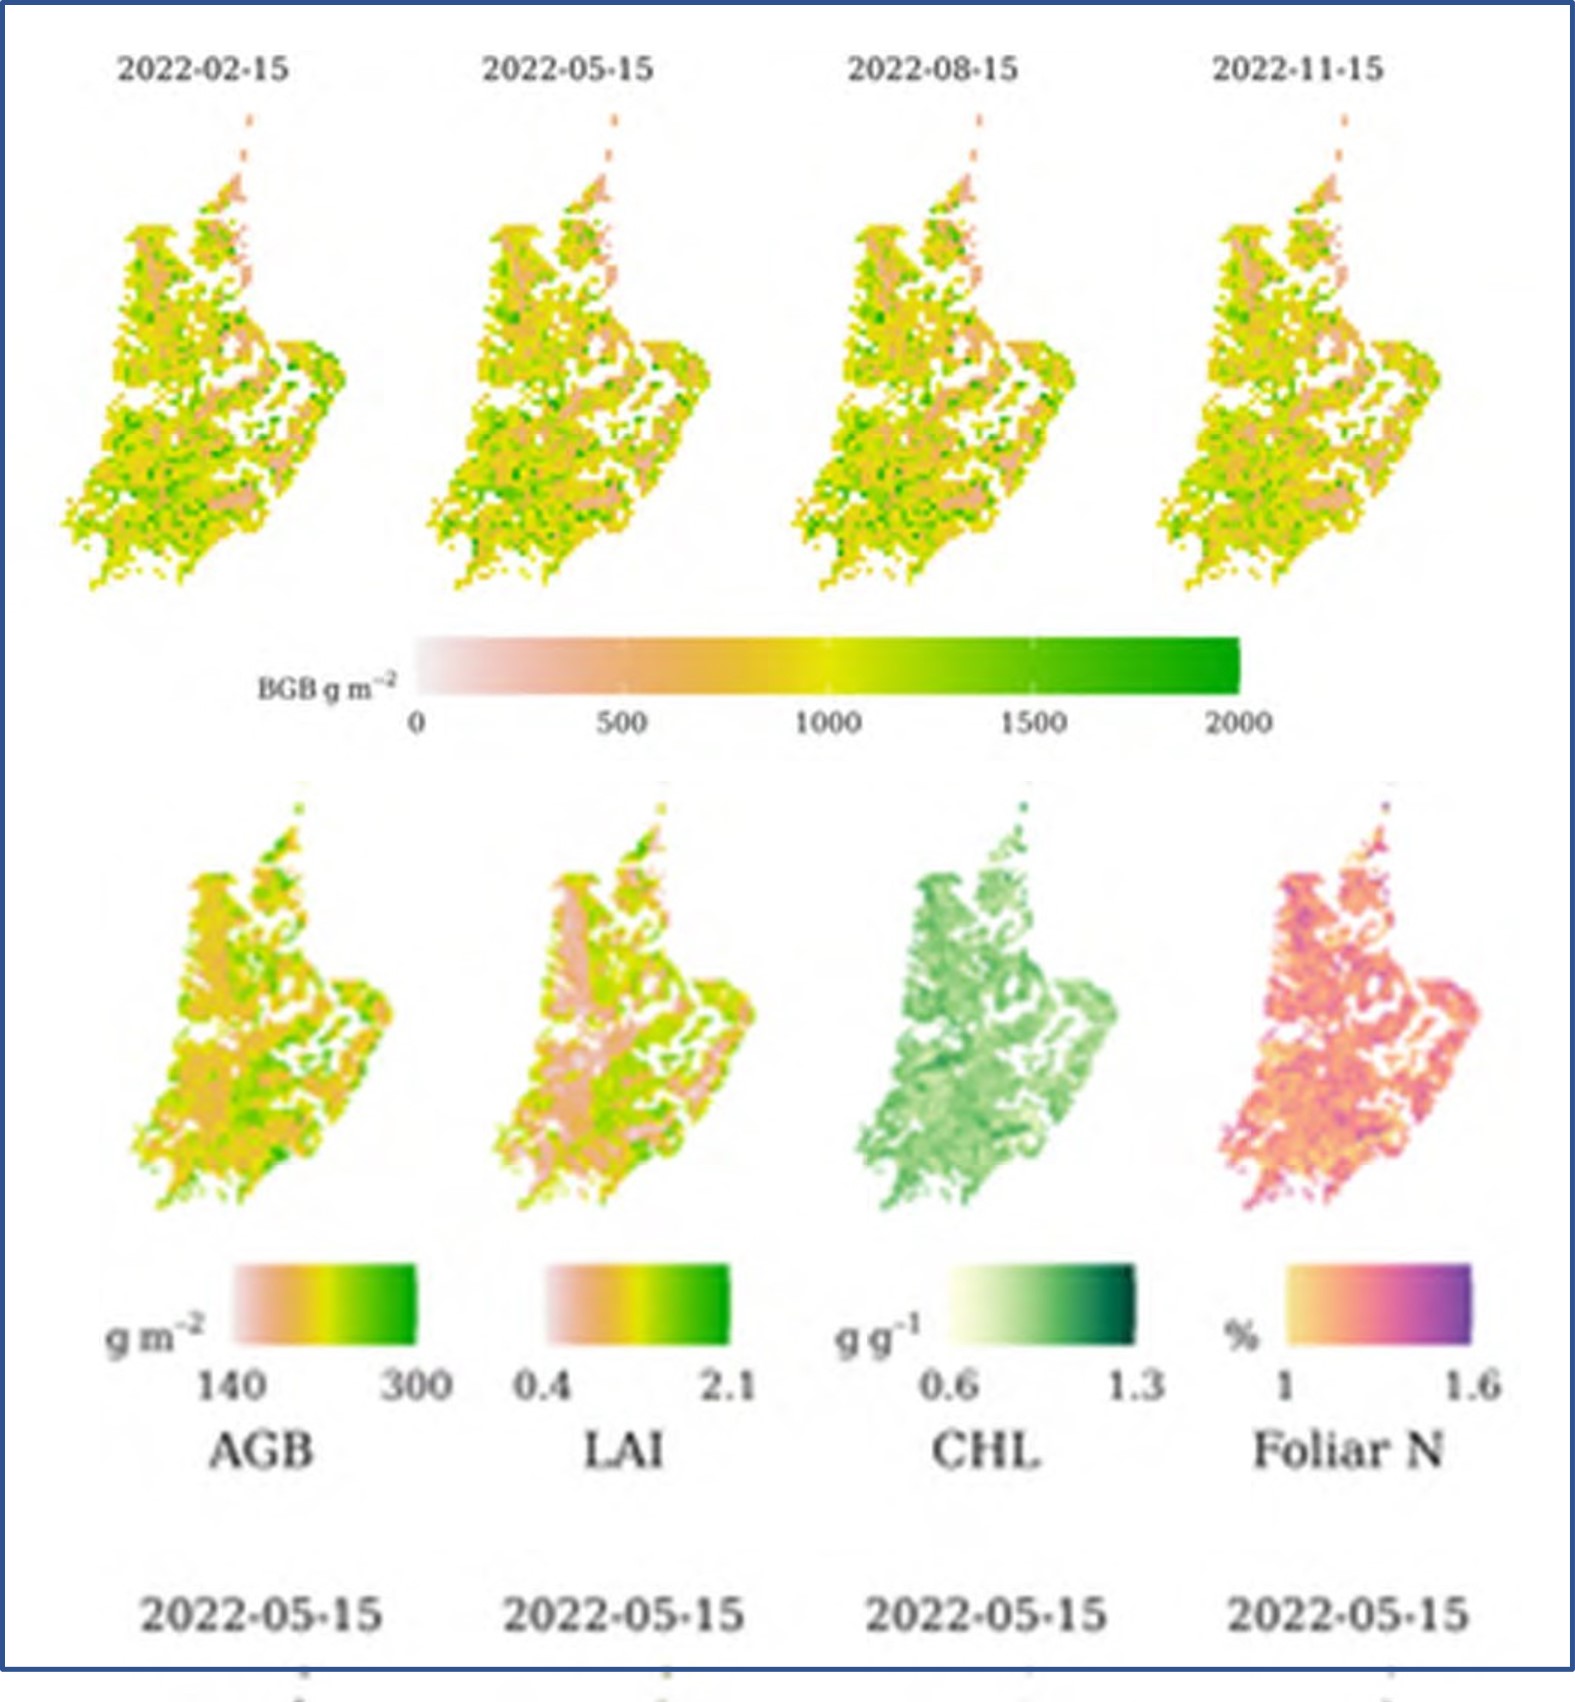
Fig. 5. Output of the BERM model showing (top) predicted belowground biomass (BGB) for Feb, May, Aug, and Nov 2022 and (bottom) predicted aboveground biomass (AGB), leave area index (LAI), chlorophyll (CHL), and foliar Nitrogen for May. Source: Runion et al. in press.
- 4B.3 - Evaluate long-term change in vegetated marsh area
Activities: Mariotti et al. (2024) used a combination of historic maps and satellite data to evaluate change in marsh area along the Georgia coast since the 1850s.
Significant Results: Mariotti et al (2024) found that marsh progradation and loss are largely balanced along the GA coast, with a net gain in the Altamaha (Fig 6) associated with new suspended sediment input from the river as opposed to suspended sediments that were resuspended by tides or exported offshore and reintroduced by wave activity (See Key Accomplishments).
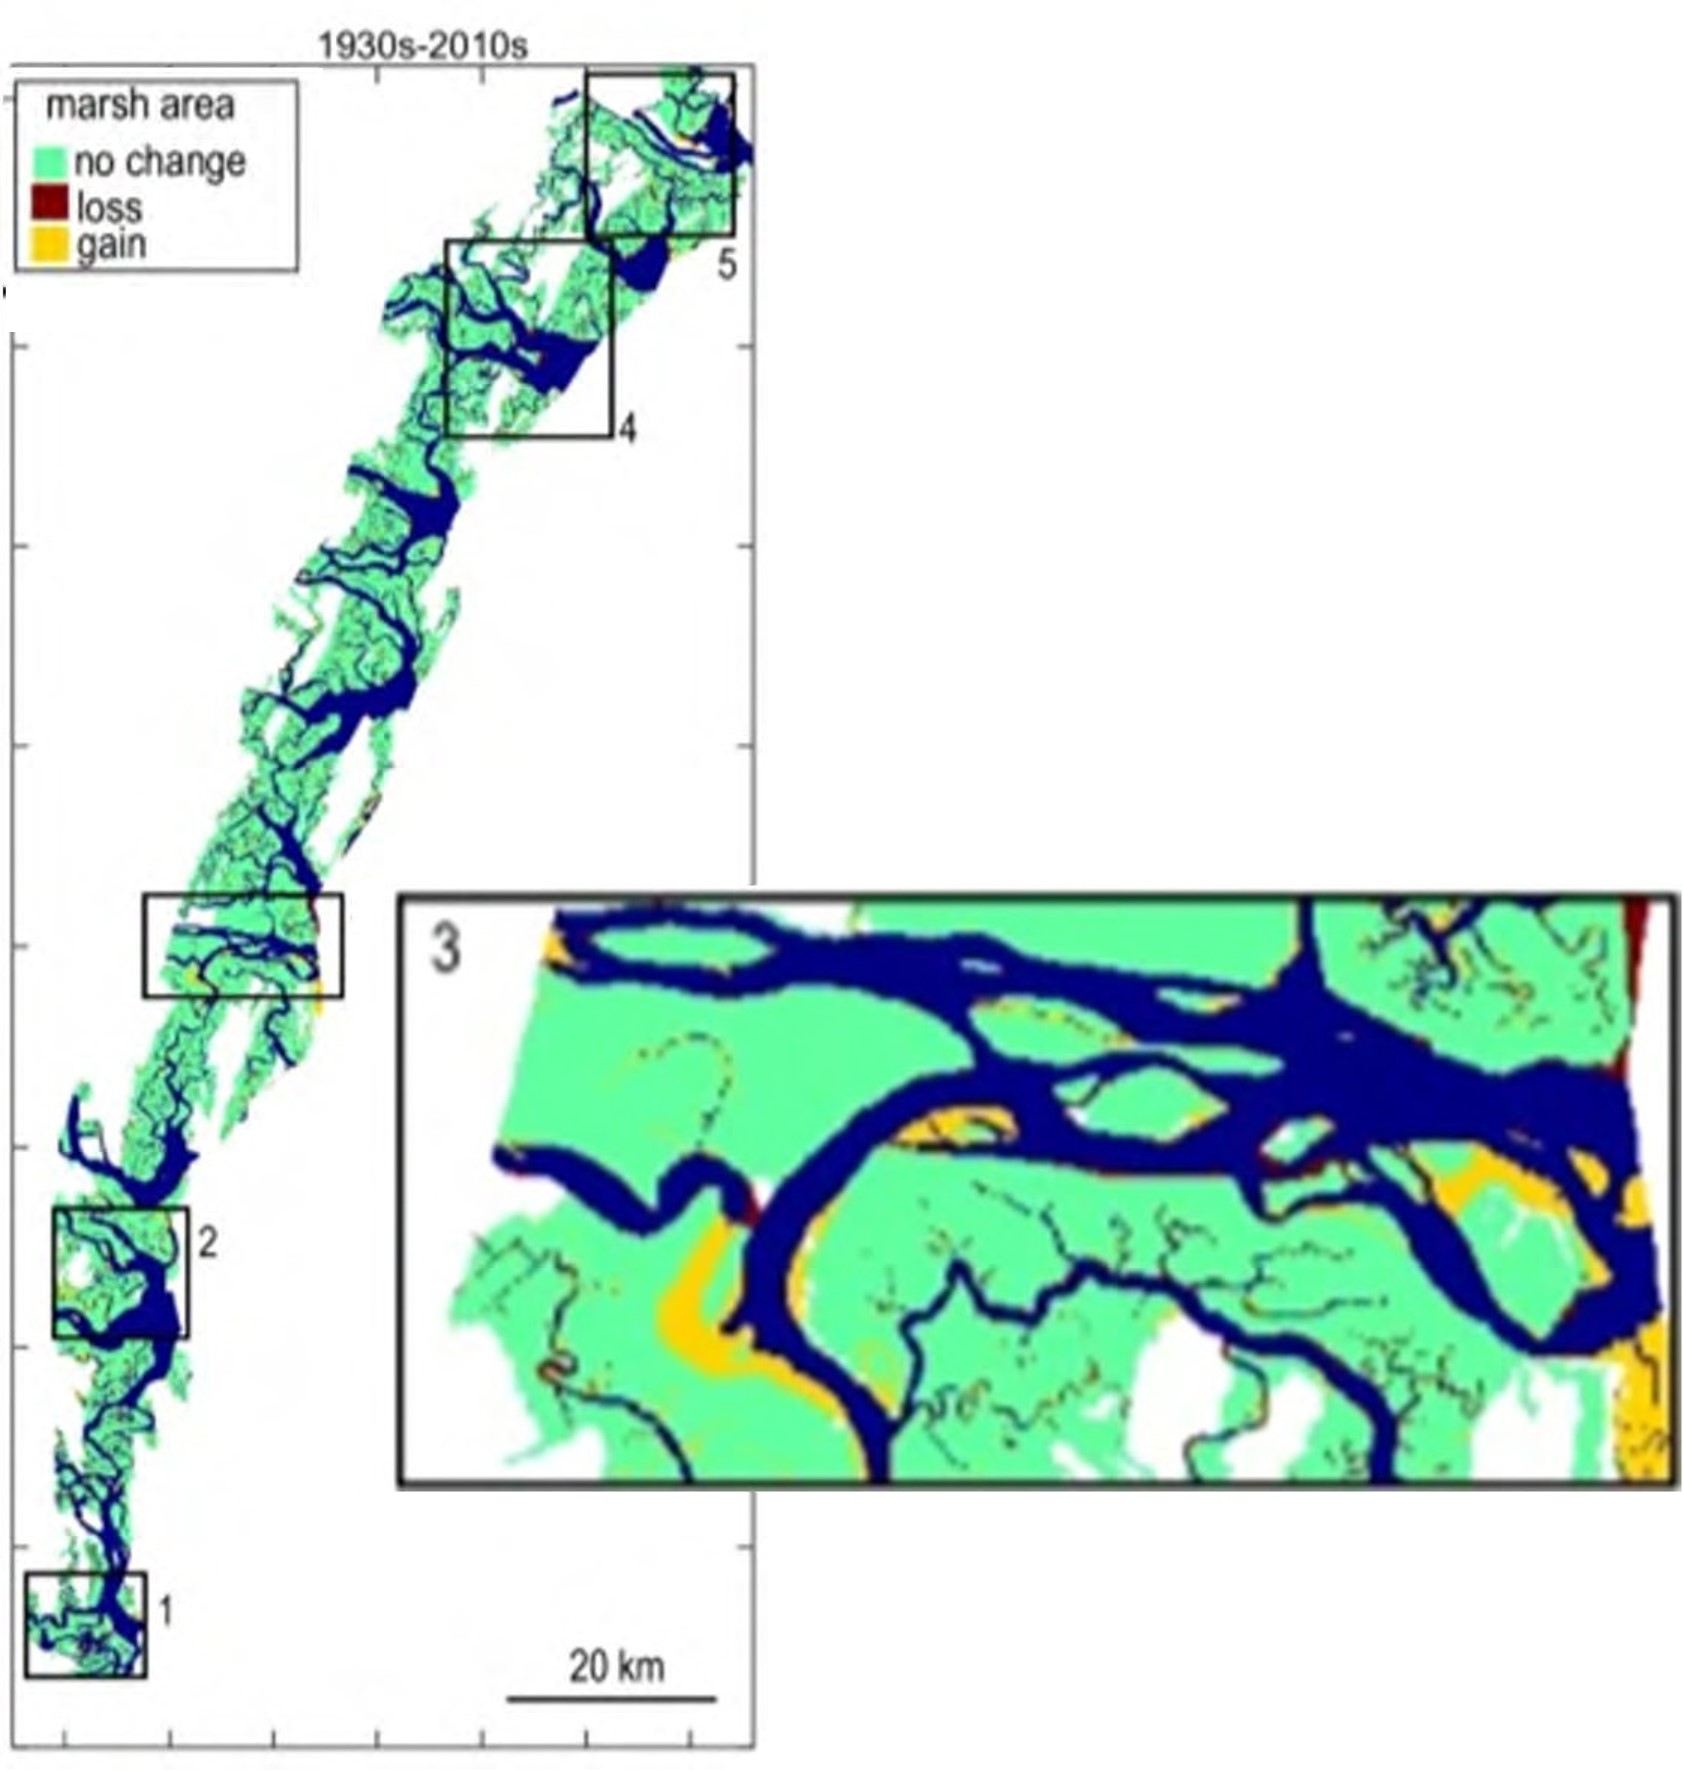
Fig. 6.Changes in marsh area along the Georgia coast from the 1930s to the 2010s. Inset shows the Altamaha River estuary. Source: Mariotti et al. 2024.
C) Modeling
- 4C.1 - Upgrade hydrodynamic models
Activities: We are continuing to implement the newest version of the Delft model, which uses a flexible mesh, to the GCE domain.
Significant Results: Model predictions show large differences in residence times across the domain, which sets the context for many of the biological and chemical processes that occur in estuaries. (Fig. 7).
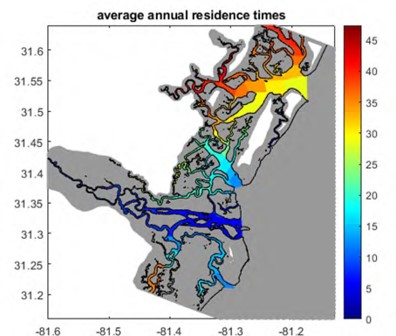
Fig. 7. Output from Delft3D showing average annual residence times in the GCE domain, calculated as the average of all months from February 2017 to January 2018. Source: M. Agonsi and R. Castalao.
- 4C.2 - Enhance soil model
Activities: We are now evaluating the performance of our remotely sensed soil temperature predictions to determine its applicability to new locations.
Significant Results: We found that using a spatiotemporal cross-validation approach during model fitting allowed the model to better predict unknown locations than traditional random cross-validation, and could be applied to new areas with confidence (Fig. 8)
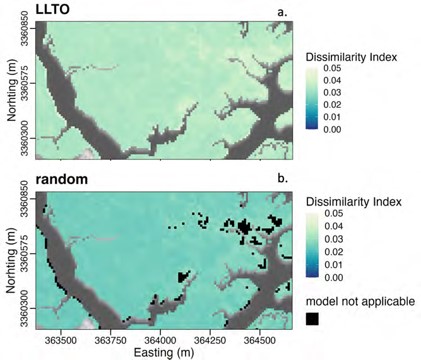
Fig. 8. Soil temperature predictions in a Juncus marsh comparing the Dissimilarity Index between a spatiotemporal cross-validation approach (LLTO, top) and a random approach (bottom).
- 4C.3 - Model plant production
Activities: Jung and Burd (2025) developed a phenology-based growth model for Spartina that incorporates the effects of light, temperature and salinity on plant production (Fig. 9).
Significant Results: Our Spartina model shows that tall form plants have the highest C translocation to below-ground tissue, indicating a substantial contribution to C sequestration (Jung and Burd 2025)
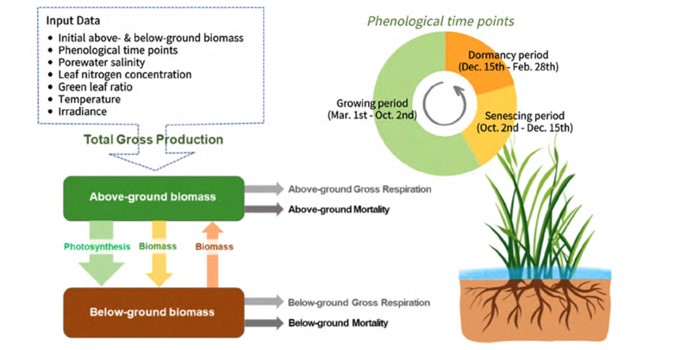
Fig. 9. Structure of the phenology-based growth dynamic model (PG model) adapted from Morris et al. (1984) and Zheng et al. (2016). Source: Jung and Burd 2025.
- 4C.4 - Develop driver-response models
Activities: The BERM model consists of a suite of models to predict four aboveground metrics and belowground biomass. BERM models utilize extreme gradient boosting (XGB), a decision tree ensemble machine-learning algorithm, to produce a regression-based prediction model (Runion et al. in press).
Significant Results: Runion et al. (in press) found that hydrologic variables (flooding frequency,
inundation intensity, and flooding duration) were the most influential features in predicting BGB.
|
Area 4 Publications from GCE-IV
Costomiris, G., Hladik, C.M. and Craft, C.B. 2024. Multivariate Analysis of the Community Composition of Tidal Freshwater Forests on the Altamaha River, Georgia. Special Issue: Coastal Forest Dynamics and Coastline Erosion—Series II. Forests. 15(1). (DOI: 10.3390/f15010200)
Lehmann, M.K., Gurlin, D., Pahlevan, N., Binding, C., Fichot, C., Gitelson, A., Mishra, D., Schalles, J.F., Simis, S., Smith, B. and Spyrakos, E. 2023. GLORIA - A globally representative hyperspectral in situ dataset for optical sensing of water quality. Nature - Scientific Data. 10:1130958, 6 April 2023(100 (2023)):13 p. (DOI: doi.org/10.1038/s41597-023-01973-y)
Robinson, M., Alexander, C.R. Jr. and Venherm, C. 2022. Shallow Water Estuarine Mapping in High-Tide-Range Environments: A Case Study from Georgia, USA. Special Issue: Shallow Water Mapping. Estuaries and Coasts. 45:980-999. (DOI: https://doi.org/10.1007/s12237-021-01032-y)
O'Connell, J.L., Mishra, D., Alber, M. and Byrd, K.B. 2021. BERM: A belowground ecosystem resilience model for estimating Spartina alterniflora belowground biomass. New Phytologist. (DOI: 10.1111/nph.17607)
Schaeffer, B., Neely, M., Spinosa, A., Serafy, E., Odermatt, D., Weathers, K., Barracchini, T., Bouffard, D., Carvalho, L., Comny, R., De Keukelaere, P., Hunter, P., Jamet, C., Joehnk, K., Johnston, J., Knudby, A., Minaudo, C., Pahlevan, N., Rose, K., Schalles, J.F. and Tzortziou, M. 2021. Integrating inland and coastal water quality data for actionable knowledge. Special Issue: Big Earth Data and Remote Sensing in Coastal Environments. Remote Sensing. 13; 23 July 2021(15):24 p. (DOI: doi.org/10
Wu, F., Pennings, S.C., Ortals, C., Ruiz, J., Farrell, W.R., McNichol, S.M., Angelini, C., Spivak, A.C., Alber, M. and Tong, C. 2021. Disturbance is complicated: headward-eroding saltmarsh creeks produce multiple responses and recovery trajectories. Limnology & Oceanography. 67:S86-S100. (DOI: 10.1002/lno.11867)
Zinnert, J.C., Nippert, J.B., Rudgers, J.A., Pennings, S.C., Gonzalez, G., Alber, M., Baer, S.G., Blair, J.M., Burd, A.B., Collins, S.L., Craft, C.B., Di Iorio, D., Dodds, W.K., Groffman, P.M., Herbert, E., Hladik, C.M., Li, F., Litvak, M., Newsome, S., O'Donnell, J., Pockman, W.T., Schalles, J.F. and Young, D.R. 2021. State Changes: Insights from the U.S. Long Term Ecological Research Network. Ecosphere. (DOI: 10.1002/ecs2.3433)
Burns, C., Alber, M. and Alexander, C.R. Jr. 2020. Historical Changes in the Vegetated Area of Salt Marshes. Estuaries and Coasts. (DOI: https://doi.org/10.1007/s12237-020-00781-6)
Burns, C., Alexander, C.R. Jr. and Alber, M. 2020. Assessing long-term trends in lateral salt-marsh shoreline change along a U.S. East Coast latitudinal gradient. Journal of Coastal Research. 37(2):291-301. (DOI: 10.2112/JCOASTRES-D-19-00043.1)
Crotty, S.M., Ortals, C., Pettengill, T.M., Shi, L., Olabarrieta, M., Joyce, M.A., Altieri, A.H., Morrison, E., Bianchi, T.S., Craft, C.B., Bertness, M.D. and Angelini, C. 2020. Sea-level rise and the emergence of a keystone grazer alter the geomorphic evolution and ecology of southeast US salt marshes. PNAS. 117:17891-17902. (DOI: https://doi.org/10.1073/pnas.1917869117)
Feagin, R.A., Forbrich, I., Huff, T.P., Barr, J.G., Ruiz-Plancarte, J., Fuentes, J.D., Najjar, R., Vargas, R., Vazquez-Lule, A.L., Windham-Myers, L., Kroeger, K.D., Ward, E.J., Moore, G.W., Leclerc, M.Y., Krauss, K.W., Stagg, C.L., Alber, M., Knox, S.H., Schafer, K.V.R., Bianchi, T.S., Hutchings, J.A., Nahrawi, H.B., Noormets, A., Mitra, B., Jaimes, A., Hinson, A.L., Bergamaschi, B. and King, J.S. 2020. Tidal wetland Gross Primary Production across the continental United States, 2000-2019. Globa
Langston, A., Alexander, C.R. Jr., Alber, M. and Kirwan, M. 2020. Beyond 2100: Elevation capital disguises salt marsh vulnerability to sea-level rise in Georgia, USA. Estuarine, Coastal and Shelf Science.
O'Connell, J.L., Alber, M. and Pennings, S.C. 2020. Microspatial differences in soil temperature cause phenology change on par with long-term climate warming in salt marshes. Ecosystems. 23:498–510. (DOI: https://doi.org/10.1007/s10021-019-00418-1)
Spivak, A.C., Sanderman, J., Bowen, J.L., Canuel, E.A. and Hopkinson, C.S. 2019. Global-change controls on soil-carbon accumulation and loss in coastal vegetated ecosystems. Nature Geoscience. 12:685–692. (DOI: https://doi.org/10.1038/s41561-019-0435-2)
Miklesh, D.M. and Meile, C. 2018. Controls on porewater salinity in a Southeastern salt marsh. PeerJ. 6:e5911. (DOI: 10.7717/peerj.5911)
Vu, H. and Pennings, S.C. 2018. Predators mediate above- vs belowground herbivory in a salt marsh crab. Ecosphere. 9(2):e02107. (DOI: 10.1002/ecs2.2107)
Vu, H., Wieski, K. and Pennings, S.C. 2017. Ecosystem engineers drive creek formation in salt marshes. Ecology. 98(1):162-174.
Wang, Y., Castelao, R. and Di Iorio, D. 2017. Salinity Variability and Water Exchange in Interconnected Estuaries. Estuaries and Coasts. (DOI: 10.1007/s12237-016-0195-9)
Angelini, C., Griffin, J., van de Koppel, J., Derksen-Hooijberg, M., Lamers, L., Smolders, A.J.P., van der Heide, T. and Silliman, B.R. 2016. A keystone mutualism underpins resilience of a coastal ecosystem to drought. Nature Communications. 7:12473. (DOI: 10.1038/ncomms12473)
O'Donnell, J. and Schalles, J.F. 2016. Examination of Abiotic Drivers and Their Influence on Spartina alterniflora Biomass over a Twenty-Eight Year Period Using Landsat 5 TM Satellite Imagery of the Central Georgia Coast. Special Issue: Remote Sensing in Coastal Environments. Remote Sensing. 8(6):22. (DOI: 10.3390/rs8060477)
McFarlin, C.R., Bishop, T.D., Hester, M. and Alber, M. 2015. Context-dependent effects of the loss of Spartina alterniflora on salt marsh invertebrate communities. Estuarine, Coastal and Shelf Science. 163:218-230. (DOI: 10.1016/j.ecss.2015.05.045)
Hladik, C.M., Schalles, J.F. and Alber, M. 2013. Salt marsh elevation and habitat mapping using hyperspectral and LIDAR data. Remote Sensing of the Environment. 139:318 - 330. (DOI: 10.1016/j.rse.2013.08.003)
Pennings, S.C. and Silliman, B.R. 2005. Linking biogeography and community ecology: latitudinal variation in plant-herbivore interaction strength. Ecology. 86:2310-2319.
McKnight, C.J. 2016. A modelling study of horizontal transport and residence time in the Duplin River estuary, Sapelo Island GA. M.S. Thesis. University of Georgia, Athens, GA.
Schalles, J.F. and Peffer, C. Presentation: Regulatory, Legal, and Ethical Considerations for Drone Operations - The view from coastal Georgia . Regulatory Legal and Ethical Considerations for Drone Operations. Drones in the Coastal Zone - U.S. Southeast and Caribbean Regional Workshop, October 22, 2020, Virtual (web-based).
Schalles, J.F. Presentation: High resolution salt marsh vegetation biomass mapping with an Altum 6 band camera and Matrice 210 drone. Introduction to Using Drones in the Coastal Zone. Drones in the Coastal Zone - U.S. Southeast and Caribbean Regional Workshop, October 14, 2020, Virtual (web-based).
O'Connell, J.L., Alber, M., Mishra, D. and Byrd, K. 2020. Presentation: Structural heterogeneity in above vs belowground biomass pools differ for Spartina alterniflora monocultures, with consequences for forecasting ecosystem resiliency. Ecological Society of America.
Sheldon, J.E. and Alber, M. 2019. An Examination of High Salinity Events in the Altamaha River Estuary. In: Review prepared for GA DNR-CRD.
|
| |
|


