GCE IV - Key Finding in 2024
Long-term marsh survival
Are we losing marsh area? Although marshes have historically kept pace with rising seas, understanding patterns of loss and gain can provide insight into which areas are most vulnerable to future sea level rise. GCE investigators are addressing this question using historical aerial photos, sediment cores, remote sensing, and modeling. We have conducted several studies examining changes in marsh spatial extent at local and larger scales. Burns et al. (2020 a, b) used historical aerial photos to measure changes in marsh area between 1942 and 2013 in a 25 km2 area of the GCE. Although there were large gains and losses within the site, there was little net change over 70 years. Mariotti et al. (2024) evaluated the whole Georgia coast over a longer time-scale (1850s to 2010s). They also found large gross gains and losses in marsh spatial extent but little net change. Spatial patterns of expansion and retreat varied over time and along the coast and may relate to human land use change (e.g., dam installation). Of particular interest were areas of new marsh formation at the mouth of the Altamaha Estuary, which they linked to an increase in sediment input from the river. It is also important to understand the processes contributing to marsh vertical elevation gain. GCE investigators Alexander and Spivak are measuring accretion rates and soil carbon stocks in recently collected soil cores from across the Georgia coast in order to identify which areas are most vulnerable to sea-level rise. In comparison to other areas, however, the marshes around GCE are perched high in the tidal frame and this elevation capital is expected to keep marshes resilient against sea-level rise through 2100 (Langston et al. 2020). Accretion rates in GCE marshes were put into a regional context by Weston et al. (2023), who evaluated cores collected from 9 riverine estuaries along the east coast, including the Altamaha Estuary (Fig. 1). They found that rates of accretion have increased over time, and that this was explained by relative sea-level rise, sediment availability, and temperature.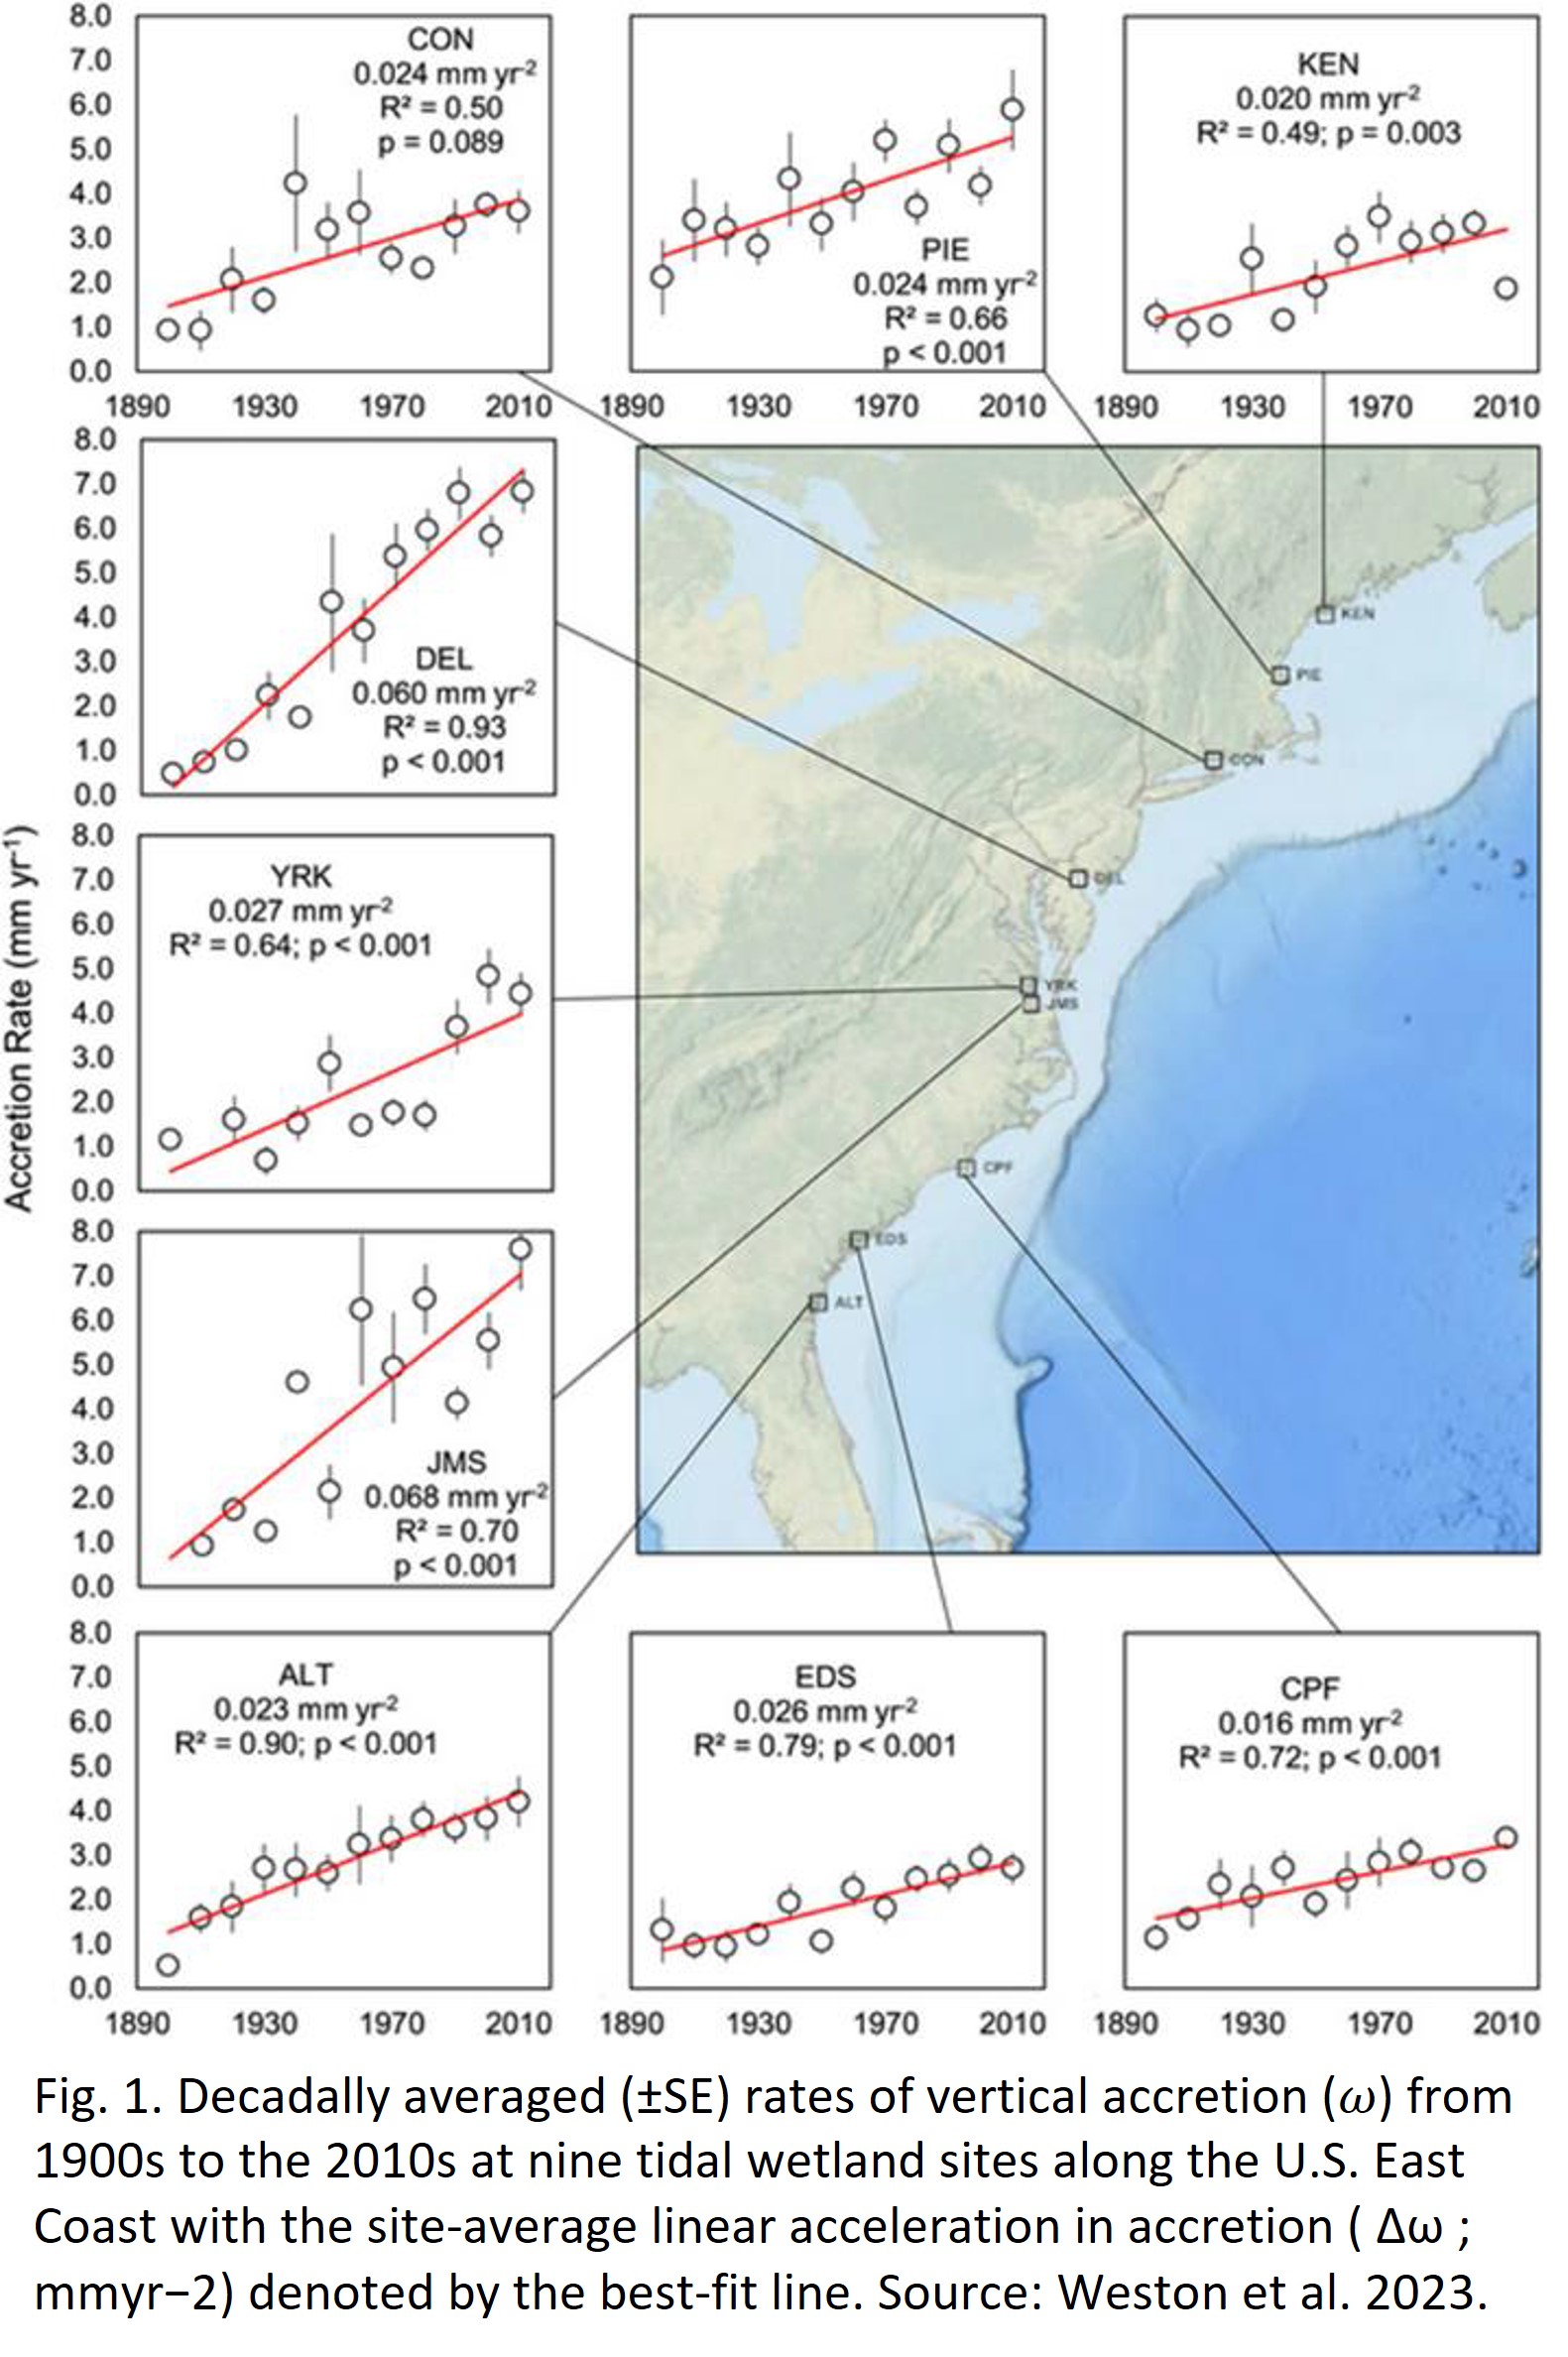
Fig. 1. Decadally averaged ( SE) rates of vertical accretion (± ) from 1900s to the 2010s at nine tidal wetland sites along the U.S. East Coast with the site average linear acceleration in accretion ( Δ ω ; mm yr -2 ) denoted by the best fit line. Source: Weston et al. 2023.
